
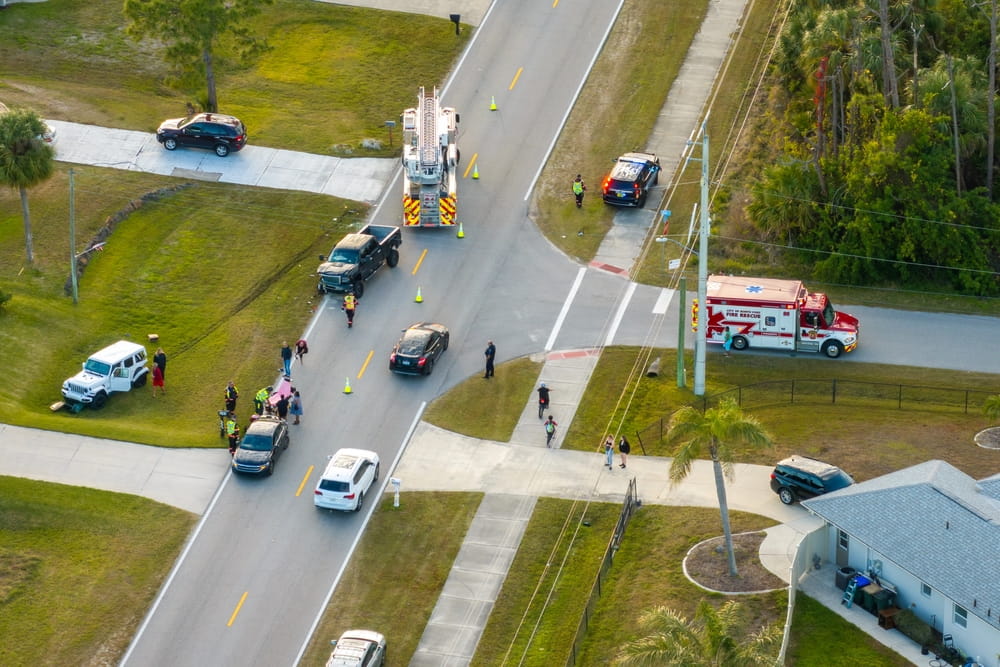
A quiet Staten Island intersection can look far safer than a crowded Brooklyn crossing filled with cars, cyclists, and pedestrians. Boroughwide numbers seem to support that impression, with Brooklyn recording 63 traffic deaths in 2025 compared with Staten Island’s 13. However, lower totals for Staten Island intersection accidents would not prove that comparable intersections are actually safer.
Staten Island has fewer residents and a smaller street network, so raw crash numbers don’t make for an equal comparison. When comparing intersection risks, consider traffic volume, pedestrian activity, cycling, injury severity, and street design. A Staten Island car accident lawyer can review an intersection crash and explain how roadway conditions and other evidence may affect liability and compensation.
Table of Contents
- Can Intersection Data Show Which Borough Carries More Risk?
- Do Different Road Users Face Different Risks?
- Why Can a Simple Borough Comparison Be Misleading?
- When Should You Contact a Staten Island Car Accident Lawyer?
- Frequently Asked Questions
Can Intersection Data Show Which Borough Carries More Risk?
The more useful question is whether similar intersections in the two boroughs have different crash and injury patterns.
Which Measures Make the Borough Comparison Fair?
NYPD crash data includes coordinates, street names, cross streets, injuries, deaths, and contributing factors. That makes it possible to identify crashes near intersections in both boroughs and apply the same distance rule to each location.
From there, you can compare Staten Island intersection accidents and Brooklyn intersection accidents by total crashes, injuries, pedestrian harm, cyclist harm, and serious or fatal crashes. Those numbers still need context. NYC intersection accidents are shaped by how many intersections each borough has and how much walking, cycling, and driving takes place there.
How Much Do Population and Travel Patterns Affect the Results?
A great deal. NYC DOT’s earlier Vision Zero work examined more than 10,000 Brooklyn intersections and more than 8,000 Staten Island intersections. It identified 91 priority pedestrian intersections in Brooklyn and 17 on Staten Island.
Those are historical figures, so they should not be treated as a current ranking of the boroughs. They do show why Staten Island traffic safety cannot be judged from totals alone. Brooklyn has a denser street system, while travel patterns also differ between the two boroughs.
Do Different Road Users Face Different Risks?
An intersection may be relatively safe for motorists but still create problems for pedestrians or cyclists. Each group needs separate consideration.
Where Does Staten Island Pedestrian Risk Appear?
Staten Island’s older pedestrian safety data shows why an intersection-only comparison would miss part of the problem. NYC DOT found that 45% of pedestrian deaths on Staten Island occurred midblock, compared with about one-third citywide. Nine out of ten Staten Island pedestrian deaths involved passenger vehicles.
The highest-risk areas were concentrated on the North and East Shores. For pedestrian accidents Staten Island, this means intersection injuries tell only part of the story. Serious midblock crashes should be looked at separately rather than mixed into an intersection comparison.
How Should Cyclist and Motorist Injuries Be Compared?
Cyclists also need their own measure. NYPD collision data separates pedestrian, cyclist, and motorist injuries, which allows each group to be studied on its own. Cycling activity and nearby bike routes can help explain why some intersections record more cyclist crashes than others.
For Staten Island car crashes, factors such as unsafe speed, turning movements, failure to yield, and lane use may provide more useful detail than boroughwide deaths. Brooklyn went from 69 traffic deaths in 2024 to 63 in 2025. Staten Island moved from 12 to 13. Those numbers describe the larger trend, not one intersection.
Why Can a Simple Borough Comparison Be Misleading?
A borough with more people, trips, and heavily used intersections would normally be expected to record more crashes.
Would Raw Crash Counts Give a Fair Answer?
No. If Brooklyn has more crashes overall, it doesn’t automatically mean that a person is in more danger at an equivalent intersection in Brooklyn. A better comparison would be to calculate crashes per intersection and analyze injuries by road-user type.
The number of residents, cars on the road, pedestrians, and cyclists can also affect the statistics. So there are different factors to consider, and a single value cannot give you an accurate idea of the situation. Several indicators should be used to compare the safety level of two areas.
What Role Does Street Design Play in the Difference?
Street design can change the risks people face. Staten Island has major arterial roads that differ from many of Brooklyn’s tighter residential and commercial streets. Its earlier Vision Zero plan identified speeding, failure to yield, and wide roads as important pedestrian concerns.
Conditions may improve with street redesigns. NYC DOT saw a 38% drop in pedestrian deaths on previously identified Priority Corridors on both Brooklyn and Staten Island compared to the earlier study period. This shows how current street design affects intersection safety comparisons.
When Should You Contact a Staten Island Car Accident Lawyer?
Borough statistics provide background, but they don’t show who caused a particular collision.
Which Details Should Drivers Preserve at the Scene?
When possible, take photos of the vehicles, traffic lights, signs, lane markings, crosswalks, and surrounding roadway. Dash-camera footage, witness details, nearby surveillance video, police records, insurance information, and medical records may also help.
A car accident lawyer in Staten Island may be useful when drivers disagree about a traffic light, turn, right-of-way, or lane position, or when someone suffers a serious injury. A history of crashes at that intersection may provide context, but it does not prove fault.
How Can the Specific Intersection Change the Analysis?
Two intersections in the same borough can handle very different traffic. A large arterial crossing may carry many more cars and pedestrians than a small residential four-way stop.
That makes the exact location important. Visibility, lane layout, signals, crosswalks, turning movements, vehicle positions, and available video can all help explain what happened. Those details usually matter more in one crash than a boroughwide safety average.
Frequently Asked Questions
Are Raw Crash Totals Lower on Staten Island?
Generally, yes, but lower totals do not prove that comparable Staten Island intersections are safer.
Which Records Track NYC Intersection Crashes?
NYPD collision data includes coordinates, cross streets, injuries, deaths, road-user categories, and contributing factors.
Can Boroughwide Numbers Show Pedestrian Safety?
Not by themselves. Staten Island has historically recorded a large share of severe pedestrian crashes away from intersections.
Did Priority Corridors Improve in Both Boroughs?
Yes. NYC DOT reported a 38% decline in pedestrian deaths on previously identified Priority Corridors in both boroughs.
Is Population Alone Enough to Measure Risk?
No. Traffic volume, walking and cycling activity, intersection use, and street design also affect crash risk.